


Price Action: What It Is and How to Understand It for Successful Trading
Price Action is a trading and market analysis technique that empowers traders to make informed decisions based on real price movements. It stands in contrast to other methods that rely on indicators, which often lag behind current market prices. Note that this isn’t to dismiss the value of indicators in analysis and trading; they serve their purpose, but price action offers a more immediate approach.
The majority of indicators analyze past price data using their formulas, rendering them reactive rather than predictive. In contrast, by employing specific trading strategies, traders can leverage historical data to anticipate potential market movements using price action analysis, reducing the need for guesswork.
Price Action Unveiled
Through the analysis of price patterns, seeks to decipher the seemingly random order within the market. Price action traders take their analysis a step further, focusing not just on what is happening but why it’s happening. This deeper understanding equips them to make more informed decisions.
Price action manifests in various forms, including swings, which represent high and low turning points in the market, as well as the testing of support and resistance levels. These patterns help traders identify trends and key market points. Essential tools for price action analysis include Japanese candlestick charts and bar charts.
Candlestick Patterns in Price Action
In price action analysis, candlestick patterns such as Harami, Engulfing, Shooting Star, and more play a pivotal role. These patterns provide valuable insights into market dynamics and can guide traders in their decision-making process.
Who is a Price Action Trader?
A Price Action Trader is an individual who employs the Price Action method in their trading approach. This group of traders finds simplicity at the core of their strategy, and paradoxically, it’s this simplicity that makes it an effective method in trading: seeing everything in its simplest form. Price Action Traders integrate factors like price volatility, chart patterns, trading volume, and other relevant market data to inform their trading decisions.
It’s important to note that while Price Action Trading has its merits, it may not necessarily be the best method for all market analyses. Successful implementation of this method requires a deep understanding of the market’s behavior, an awareness of how it moves, and insight into its internal order. However, the advantage of Price Action Trading lies in its versatility; it can be applied to various markets, including the stock market, forex, futures, commodities like gold and oil, and more.
The Purest Form: Tape Traders
Among Price Action Traders, there exists a subset known as Tape Traders. These traders exemplify the purest form of Price Action Trading. Unlike traditional traders who heavily rely on charts, Tape Traders operate with minimal visual aids and instead focus on identifying support and resistance areas to capitalize on market movements. Their primary tools are often confined to the Time and Sales window or, occasionally, the Depth of Market.
Advantages of Trading Based on Price Action
Trading based on Price Action offers several distinct advantages for traders of all levels:
1. Cost-Efficiency: Price Action Trading is cost-effective as it doesn’t require additional software or expensive indicators. Traders can rely on basic charts, whether they use candlestick, bar, or point charts, to access essential information.
2. Market Versatility: This method is incredibly versatile and adaptable, making it applicable to various markets, including stocks, forex, futures, and commodities. Regardless of the market you choose, Price Action Trading can be employed effectively.
3. Compatibility with Trading Software: Price Action analysis can be seamlessly integrated into popular trading software platforms such as Ninja Trader, Trade Station, Metatrader, and more. This compatibility allows traders to use their preferred tools while harnessing the power of Price Action.
4. Real-Time Execution: One of the standout features of Price Action Trading is its real-time execution. There’s no price lag, meaning you receive up-to-the-minute market data without any delay. This immediate information empowers traders to make swift and informed decisions.
5. Comprehensive Approach: Price Action is a comprehensive method that incorporates multiple aspects of market analysis, including price patterns, support and resistance levels, and trading volume. Despite its complexity, it excels at presenting this information in a straightforward manner, avoiding information overload.
6. The Importance of Practice: While Price Action Trading offers numerous advantages, it’s important to acknowledge that mastering this method requires time and practice. Continuous practice is the key to understanding its intricacies and achieving consistent success.
In conclusion, Price Action Trading presents a cost-effective, adaptable, and efficient approach to trading across various markets. Its compatibility with trading software and real-time execution make it a valuable tool for traders seeking simplicity and effectiveness in their strategies, although it’s essential to dedicate time to practice and refine this skill.
Tips on Price Action Patterns and Setups
Price Action analysis involves a careful examination of various aspects of candlestick behavior, which can provide valuable insights for traders. Here are some key tips to consider when working with Price Action patterns and setups:
1. Candlestick Analysis: Price Action analysts closely observe the relative size, shape, position, growth, and volume of candlesticks on a chart. These elements can reveal important information about market sentiment and potential price movements.
2. Complementary Technical Tools: While Price Action is a powerful standalone method, traders often combine it with other technical analysis tools such as moving averages, trendlines, and trading ranges. These tools can enhance the overall analysis and provide additional confirmation.
3. Integrating Techniques: Price Action traders don’t necessarily need to abandon all other technical analysis methods. They can choose to focus primarily on understanding Price Action behavior to build their trading strategy while still incorporating other tools when needed.
4. Recognizing Patterns: Price Action patterns typically form with each candlestick, and traders search for specific patterns that develop in a particular sequence. These patterns create setups that can generate buy and sell signals.
5. Entry and Exit Points: Price Action traders use these setups to identify optimal entry and exit points for their trades. Each setup has a recommended entry point, which experienced traders may refine based on their years of practical knowledge.
6. Comprehensive Approach: Typically, a single setup alone is insufficient to initiate a trade. Price Action traders often combine information from multiple candles, patterns, and setups to make informed decisions.
7. The Importance of Triggers: Once a Price Action trader has identified a strong signal, they patiently wait for an appropriate trigger point to enter or exit a trade. It’s important to note that a signal may be observed during a trade, but it only becomes a valid trigger if the desired candle closes according to the analysis.
8. Risk Management:
After entering a trade, it’s crucial to establish a predefined loss limit or stop-loss order. This precaution helps mitigate potential losses and is a fundamental aspect of responsible trading.
Incorporating these tips into your Price Action strategy can enhance your ability to decipher market movements and make well-informed trading decisions. Remember that practice and continuous learning are essential for mastering the art of Price Action analysis.
The “Retry” Rule in Price Action
One of the crucial observations made by Price Action traders is the tendency of the market to revisit certain levels after breaking or correcting. When the market retraces to a specific point, traders anticipate one of two outcomes: it will either continue its previous trajectory or retrace once more. In such scenarios, it’s prudent for traders to exercise patience and refrain from taking immediate action until the market clearly commits to one of these two paths.
Once the market resolves its course and demonstrates a definitive direction, the likelihood of a successful trade significantly increases. Consequently, traders wait for a second entry point to confirm the market’s intent.
For instance, consider a situation where sellers attempt to drive prices to a new low on the second attempt. If this endeavor fails, a double bottom pattern emerges, prompting sellers to change their stance and become buyers. This transition results in the emergence of strong buying pressure as sellers join the ranks of buyers.
Confirmation: When the Market Returns
Suppose the market initially breaks a trendline or a trading range and subsequently retraces to the broken level but fails to continue its previous trajectory. In such cases, this state is referred to as “confirmation.” It suggests that the market has firmly committed to a new direction.
Trapped Traders in Price Action
The term “trapped traders” is commonly used in Price Action and pertains to traders who entered the market based on weak signals or without waiting for confirmation. These traders often find themselves in a losing position because the market moves against their trade. To mitigate potential losses, many traders employ stop-loss orders, which automatically close their positions when prices move against them.
However, this stop-loss mechanism can lead to a cascade effect among trapped traders. When prices hit the stop-loss levels set by these traders, their orders transform into market orders, reinforcing the market’s movement in the opposite direction.
It’s worth noting that strategies for dealing with trapped traders draw inspiration from the methods pioneered by Al Brooks, a prominent figure in Price Action trading.
Incorporating the “retry” rule and understanding the dynamics of trapped traders can be valuable components of a Price Action trader’s toolkit, aiding in more informed decision-making and risk management.
Definition of Trading Trend and Range
The concept of a trading trend is fundamental in technical analysis. Trends can be broadly categorized as either upward or downward. In an upward trend, prices consistently rise, while in a downward trend, prices consistently decline. While the definition of a trend is straightforward, its analysis can be intricate and challenging.
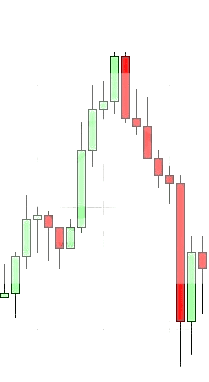
In essence, the underlying assumption when defining a trend is the notion of interdependence. This implies that when a trend is established, the market is expected to continue moving in the same direction. To illustrate, in the chart below, we can observe a downward trend characterized by a continuous decline in prices, with occasional corrections occurring in the upward phases.

Analyzing Market Trends and Trading Ranges in Price Action
For a Price Action trader operating in any time frame, the initial step involves assessing the prevailing market trend, which can be categorized as either bullish, bearish, or corrective.
Bullish Trend: In a bullish trend, prices exhibit a consistent upward movement, reflecting positive market sentiment.
Bearish Trend: Conversely, in a bearish trend, prices consistently decline, signaling a prevailing pessimistic market sentiment.
Corrective Market: A corrective market emerges when the market undergoes reversals that oscillate between price ceilings and floors, leading to the market’s consolidation within a specific price range. Defining the exact parameters of a trading range can be somewhat ambiguous, but it generally occurs when the prevailing trend is unclear or indecisive.
Trading Range or Horizontal Channel: The term “trading range” is often synonymous with a horizontal channel. This scenario is illustrated when the market frequently reverses at defined upper and lower price levels, resulting in price fluctuations confined within a specific range.
Introduction to Price Action Patterns and Setups
In the world of Price Action trading, a candlestick serves as a vital tool, offering valuable insights into market dynamics. To understand these patterns and setups better, let’s dissect the different components of a candlestick:
1. Open Price:
The initial price at the start of a trading period. 2. Close Price: The final price at the end of the trading period. 3. High (Top): The highest price reached during the trading period. 4. Low (Bottom): The lowest price reached during the trading period. 5. Body: The segment of the candlestick between the open and close prices. 6. Tail or Shadow (Top and Bottom): The portions of the candlestick that extend beyond the open and close prices.
Within Price Action analysis, candles can be categorized into different types:
1. Corrective Candle:
This candle lacks a body, meaning that the opening and closing prices are identical. It signifies that the market traded within a narrow range during that period. On lower time frames, this can indicate the formation of a trading range.
2. Trend Candles:
Trend candles exhibit a clear direction, either ascending or descending, and have a discernible body. These candles reflect significant price movement from the candle’s opening to closing prices.
- Uptrend Candle: In this candle, the closing price is higher than the opening price, indicating upward momentum. It may have experienced price fluctuations within the candle, but it ultimately closed higher.
- Downtrend Candle: In contrast, a downtrend candle features a closing price lower than the opening price, signaling a bearish trend.
3. Candles in the Direction of the Trend:
These candles align with the prevailing market trend. In a bullish market, an uptrend candle is a candle in the direction of the trend, while in a bearish market, it’s a downtrend candle.
4. Counter Trend Candles:
These candles develop in the opposite direction of the prevailing trend, suggesting potential reversals.
5. Breakaway Candles (BAB):
Breakaway candles are notably larger than the average candle size, deviating by two standard deviations.
6. Shadowless Candlesticks:
A shadowless candlestick has a full body and lacks shadows above or below it. It often signifies a strong trend when buying and selling pressures remain balanced throughout the candle’s formation.
7. One-Sided Shadows:
Some candles exhibit shadows on only one side, such as an upper shadow with no lower shadow. In a strong trend, this indicates equal buying and selling pressure during the candle’s duration. Traders employing the L. Brooks style may use this condition as a signal for rapid entries, executing trades slightly above or below the candle’s high or low. Speed is crucial to minimizing slippage (the difference between the signal and entry points) in such cases.
8. Inside Bar:
An inside bar candle is relatively small and fits within the high and low range of the preceding candle. Its high is lower than the previous candle’s high, and its low is higher than the previous candle’s low.
9. Outside Bar or Outer Candle:
An outside bar is larger than its predecessor and entirely engulfs it. Its high surpasses the previous candle’s high, while its low falls below the previous candle’s low.
Understanding these candlestick components and patterns is essential for Price Action traders, as they form the foundation for recognizing key market signals and setups.
What is an Outside Bar in Price Action?
The outside bar is a fundamental concept in Price Action trading, offering valuable insights into market dynamics. This candlestick pattern reflects a unique scenario where indecision reigns in the preceding candle, but the market swiftly resolves this uncertainty in the subsequent outside bar candle, resulting in a decisive price movement either upward or downward.
While the definition of an outside bar may seem straightforward, its power lies in its interaction with other Price Action patterns, which can provide traders with a strategic advantage.
Location Matters: However, the most critical factor to consider when analyzing outside bars is their location on the price chart. If the bottom of the outside bar aligns closely with the middle range, it signifies a situation akin to a trading range. In such instances, neither buyers nor sellers have been able to assert dominance, creating a balance of power.
Understanding the Pattern of Small Candles in Price Action
The presence of small candles on a price chart can convey valuable insights about market dynamics, but their significance depends on their context and origin. Generally, small candles suggest a lack of enthusiasm among market participants. However, their interpretation can vary based on the specific conditions in which they form.
Lack of Enthusiasm: Small candles often indicate a temporary pause in buying and selling activities. Market participants may adopt a wait-and-see approach, anticipating the emergence of opposing market forces before committing to a clear direction.
Potential Reversal: Small candles can also signify a lack of agreement between the forces driving the market in one direction. In such cases, they may serve as a sign of an impending reversal. The interpretation of a small candle hinges on its origin and the surrounding market conditions.
For instance, at times, small candles indicate a pause within a trend—a brief pullback. Small candles may appear at the end of this pullback, presenting an opportune moment to consider entering trades in the direction of the prevailing trend. However, under different conditions, small candles could be indicative of a trend reversal, warranting caution and potential strategy adjustments.
Trading Strategies with Small Candles:
Traders who are uncertain about the market’s immediate direction but have a clear idea of the next likely move can employ a simultaneous buy and sell order strategy. They place buy and sell orders at the upper and lower boundaries of pattern ii or iii, respectively. Subsequently, they wait for the market to break out of this corrective pattern. When the market breaks this pattern, traders enter trades in the direction of the breakout, with the order in the opposite direction serving as the stop-loss.
An approach introduced by Al Brooks involves using the ii pattern. When the ii pattern forms within a strong trend that has already breached a trendline, and the market proceeds to break this trend once more, it generates a reversal signal.
Small sidebars typically denote an equilibrium between buying and selling pressures. To apply this in trading, a pending buy order should be placed one tick in the opposite direction of the first candle within pattern ii, with the stop-loss set one tick higher than the first candle in the opposing direction.
Understanding Price Action Processes
Trend Analysis:
The core of Price Action analysis revolves around identifying trends in the market. Trends can be either upward or downward. In an uptrend, the market forms higher highs and higher lows, signifying ascending ceilings and floors. Conversely, a downtrend entails lower highs and lower lows, indicating descending ceilings and floors. To determine the trend’s direction, we connect the highs and lows, revealing the trend’s slope. A trend is established when the market forms three or four consecutive steps. It’s crucial to confirm higher highs and lows after the candle closes, avoiding premature judgments that can lead to unexpected reversals.
Swing Points:
In an uptrend, swing points represent higher ceilings, also known as swing highs, followed by a pullback that concludes at a higher floor. When the market breaches the trendline, the distance between the last swing and the breaking point is referred to as the “intermediate trend line” or “step.” Typically, Price Action traders seek two or three swings within a standard trend.
Micro Trend Lines:
Micro trend lines emerge when a significant number of tops and bottoms are formed within a short period, often spanning just a few candles. While breakouts from micro trend lines offer trading opportunities, it’s crucial to recognize that, like larger trendline breaks, they can also fail. To trade a micro trendline breakout, traders place pending orders one tick above or below the preceding candle, aligning with the prevailing trend. Micro trend lines are often employed during trend corrections or pullbacks, providing robust signals for breakouts and trendline terminations. A candle that surpasses this micro downtrend line in an uptrend, for instance, signifies a strong bullish signal and serves as the signal candle.
Spike and Channel Patterns:
The spike and channel pattern marks the initiation of a trend when the market exhibits a powerful movement in the direction of the new trend. Typically, this occurs at the start of a trading day or within the day’s chart. Following this initial surge, the market enters a narrow channel characterized by slower movement in the direction of the trend. Once the channel is breached, the market often retraces to the trend’s starting level before entering a trading range. This trading range typically spans between the trend’s starting level and the channel’s breakout point. In the case of a gap channel and spike pattern, a vertical gap exists between the current peak and the subsequent trough, signaling the commencement of a new trend.
Understanding Pullbacks in Price Action Trading
A pullback signifies a temporary interruption or modification in the prevailing market trend. However, it’s crucial to note that a genuine pullback does not extend beyond the starting point of the trend or the initial breakout point. If a pullback surpasses these critical levels, it’s more likely a false reversal or breakout rather than a genuine pullback.
Pullback Characteristics:
In a strong trend, a pullback can endure for an extended period before initiating another trend-like movement. Like a standard trend, a significant pullback typically unfolds in two steps. Price action traders often anticipate the market to adhere to this retracement before seeking signs of the second swing in the pullback failing, which would prompt a continuation of the previous trend.
Identifying Pullback Steps:
To gauge the end of a pullback and ascertain the direction of the trend, price action traders employ a method involving the counting of higher tops (H) and lower bottoms (L) within the pullback.
In an upward trend, the formation of lower tops continues until it is interrupted by a candle that closes above the high of the preceding candles, known as the “1High” candle. Conversely, in a downward trend, the corresponding candle is termed the “1Low” candle.
Two-Step Pullback:
If the pullback persists beyond the 1High or 1Low without the trend resuming, the market may produce additional bearish candles with lower highs, until a candle emerges with a high exceeding the previous high. This candle is referred to as the “2High” (2H) or “2Low” (2L) candle. This process repeats until the trend either resumes or the pullback evolves into a trading range or reversal.
Micro Trend Line Pullbacks:
When a pullback takes the form of a micro trend line, the 1High and 1Low signals remain applicable. Following the “retry” rule, the safest entry point is typically the 2High (2H) or 2Low (2L) trend. The “two-step pullback” is a common type of pullback formation, particularly in strong trends. In such robust trends, identifying individual H’s and L’s may prove challenging.
Pullback Entry Strategies:
Price action traders often seek bearish candlestick patterns, followed by bullish candlestick patterns with lower highs, as the initial signals of a pullback. A straightforward entry method involves placing a buy order one tick above the high (H) or one tick below the low (L) and executing the order as the next candle forms. The order execution candle becomes the entry candle, while the H or L candles serve as signal candles. Subsequently, setting the stop-loss one tick below H or one tick above L helps manage risk effectively.
While counting H’s and L’s is a valuable method for pullback trading, price action traders typically incorporate various other price action signals for a comprehensive approach. The choice of signals and their combination ultimately depends on the trader’s specialization and strategy.
Understanding Reversal Candlestick Patterns
A reversal candlestick pattern is a powerful signal that suggests a forthcoming reversal of the current market trend. Traders interpret this pattern as an indication that the market’s direction is likely to change. It’s essential to understand the characteristics of both bullish and bearish reversal candlesticks.
Bullish Reversal Candlestick:
A bullish reversal candlestick is identified by specific characteristics. Firstly, the closing price should be significantly distant from the opening price, creating a substantial bullish body. Additionally, it should possess a sizable lower shadow, typically ranging from 30% to 50% of the candlestick’s height, while having little to no upper shadow. Furthermore, it should exhibit a slight overlap with the preceding candles and feature a lower shadow that extends below the previous candles.
Bearish Reversal Candlestick:
Conversely, a bearish reversal candlestick presents entirely opposite characteristics. The ceiling or floor of the bearish reversal candlestick tends to be formed at an unusually higher or lower level than what’s considered normal. For instance, in a bullish reversal, the lower shadow of the candlestick extends lower than that of the previous candles. In the figure below, you can observe that the bearish trend resumes following the appearance of the bullish reversal candle.
Interpreting Bullish Reversal Candlesticks:
From a Price Action perspective, a bullish reversal candlestick signals that the selling pressure has peaked, and buyers are poised to enter the market with vigor, wresting control and dictating higher prices. This scenario often results in a rapid and steep ascent in price. Scalpers who had initially sold at the low point are now compelled to buy, further strengthening the upward movement.
Trend Line Analysis:
Drawing a trend line is a valuable tool in Price Action analysis, especially during strong trends. Any correction within the trend typically leads to a break of the trend line, indicating a period of weakness. This break suggests that the market may change direction in the near future or, at the very least, experience a temporary slowdown in the prevailing trend’s momentum.
Exploring Price Action Patterns
Twin Floor and Ceiling Patterns:
Often, the market retraces after reaching a high point, only to return to this level again. This dual reversal of market movement is known as the twin ceiling or twin floor pattern, also referred to as “ceiling and twin floor.” This pattern signals that the corrective phase in the market is likely to persist.
Al Brooks has observed that pullbacks are more probable after the occurrence of twin ceilings and floors. These pullbacks typically reach between 50% to 95% of the twin ceiling and floor levels, somewhat resembling the classic head and shoulders pattern. Trading the twin floor and ceiling pattern involves placing a pending buy order just one tick above the candle that formed the second floor (in the case of a twin floor). If the order gets filled, a stop loss is set just one tick below the same candle.
Double Top Twin and Double Bottom Twin Patterns:
These patterns manifest as multiple candlesticks with relatively large bodies and minimal shadows, sharing identical upper shadows. A double top pattern occurs at the highest point of a chart, while a double bottom pattern forms at the lowest point. These patterns often appear on smaller timeframes and yield faster but weaker signals. Price action traders frequently anticipate that other market participants will react to these patterns on smaller timeframes, causing the market to move against them. As a result, price action traders initiate trades in the opposite direction of the signal, placing buy orders just one tick above the ceiling or below the floor. The key insight here is that the presence of “trapped traders” can lead to rapid and intense market movements in the expected direction.
Reverse Double Patterns (Up-Down Twin and Down-Up Twin):
These patterns involve consecutive trends forming in opposite directions. The candle bodies and shadows in these patterns are typically of equal size. When this pattern occurs within an ongoing trend, it serves as a reversal signal. If the candles forming this pattern have no shadows, the signal is even stronger. For example, in a downtrend exhibiting a double top and bottom pattern, the absence of lower shadows in the candlesticks enhances the signal’s strength.
Trading Within a Range
A trading range emerges when there’s a lack of a discernible trend, resulting in the establishment of both a ceiling and a floor for market movements. These levels effectively delineate the market’s boundaries, acting as formidable barriers to price progression. It’s important to note that approximately 80% of market attempts to breach these boundaries are met with failure, causing the market to revert within the established range.
When the upper boundary of this trading range is breached, a new, higher ceiling comes into play. Given the complexity of trading within a range, price action traders exercise patience, waiting for a second breach to occur after the initial elevation of the ceiling. This strategy often takes on a bearish stance, offering a high likelihood of success, with the midpoint of the trading range serving as the profit target.
This method boasts several advantages. Firstly, the midpoint of the trading range functions as a magnet for price action, drawing prices toward it. Secondly, the newly established higher ceiling is positioned slightly above the range’s original ceiling, enhancing its efficiency. Lastly, in line with the law of two successive failures, when the market twice fails to breach one direction, it’s likely to pivot and move in the opposite direction.
The Barb Wire Pattern
In scenarios where the market finds itself confined within a short trading range marked by oversized candlesticks, a price action signal may emerge, albeit with limited validity and predictive power. Recognizing this, Brooks introduced a distinct pattern known as the Barb Wire. This pattern manifests as a series of candles characterized by significant overlap and interspersed with corrective candles. The Barb Wire pattern signifies that neither buyers nor sellers possess the upper hand, and neither party can exert significant pressure.
To profit in a corrective market, a price action trader must employ the appropriate strategy tailored to the trading range. Trades are executed at the support and resistance levels within the range, with profit targets established ahead of price reversals.
In Conclusion
In the simplest of terms, price action denotes the study of how prices evolve—a method that furnishes traders with signals for buying and selling. The appeal of price action stems from its unwavering credibility and its detachment from convoluted indicators.
Classified as a branch of technical analysis, price action deliberately sidesteps fundamental factors, placing its primary focus on an asset’s price history. What sets it apart from other technical analysis methods is its emphasis on the interplay between current and past prices. While other technical methods often dwell on price history with a time delay, price action remains rooted in the present.
Price action becomes most conspicuous in markets characterized by high liquidity and price volatility. However, it manifests itself in every transaction within any market. In essence, if we were to sum up the price action methodology in a single word, “simplicity” would be the most apt descriptor. It is simple not in the sense of being basic or quick to master, but in its straightforward, dependable, and accurate approach.
Price action traders are not motivated by the allure of overnight riches. Instead, they seek to become better, more proficient traders by harnessing the power of this method. While novices may be drawn to flashy indicators, seasoned traders appreciate the enduring value of simplicity and precision offered by price action.