

Elliott Wave Theory: How to Use It in Trading
What is Elliott Wave ? Price charts in financial markets may appear complex and unpredictable at first glance, but a man named Ralph Nielsen Elliott had a different perspective. He believed that the ups and downs in price charts follow distinct and regular patterns. Of course, this theory has its share of both proponents and detractors. Some critics argue that the inherent uncertainty in financial markets dismisses this theory. However, the Elliott Wave theory has garnered a strong following over the years, with many analysts still using it to navigate the market successfully and turn a profit. In this article, we will delve into these waves and the debates surrounding them, including the history of the theory.
Elliott and the Historical Evolution of his Theory
In the 1930s, Nelson Elliott conducted a comprehensive analysis of price charts spanning 75 years, leading to insights into trader behavior. According to this theory, the market exhibits recurring cycles, creating an inherent order. This order isn’t unique to financial markets alone; when you observe elements in nature like leaves, snowflakes, and other components, you’ll notice that they comprise smaller units that, on a larger scale, form a cohesive whole.
In 1946, Ralph Nelson Elliott introduced the Elliott Wave theory in his book titled “The Law of Nature, The Secret of Existence.” However, the book did not initially receive widespread attention. It wasn’t until the publication of “Elliott Wave Supplement” by Hamilton Bolton, five years after Ralph Nielsen’s death in 1953, that Elliott and his theory gained prominence. Twenty-five years later, Frost and Robert Prechter authored the renowned book “Elliott Wave Theory,” making this theory and analytical approach more prevalent among participants in financial markets.
Ralph Nielsen, in presenting his theory, asserted that price behavior in charts is influenced by the emotions and mental states of traders, which recur in predictable patterns. To clarify, this refers to instances of emotional buying and selling, where traders may shift trends driven by avarice for greater profit or the fear of loss.
Are Elliott Waves Error-Free?
It’s safe to say that neither Elliott waves nor any analytical tool or method can claim to be completely error-free. As mentioned earlier, when Elliott first introduced his wave theory, it faced opposition from those who believed that market uncertainty could undermine it.
However, Elliott’s wave theory doesn’t assert that waves always unfold in a consistent, unchanging manner. Instead, it suggests that this principle can be utilized in conjunction with other analytical methods to achieve better results. It’s important to note that some traders and analysts today rely solely on Elliott Wave analysis for their trading decisions.
Interpreting the Elliott Wave Counting Method
If you’ve ever examined price charts in different financial markets, you’ve probably observed that every uptrend includes price corrections. Within these major trends, which comprise multiple waves, movements aligned with the primary trend direction are referred to as impulse waves, while corrective waves move against the primary trend.
It’s worth noting that these principles also apply to downtrends. In other words, when the primary trend is bearish, there are five downward-moving waves aligned with the main trend and three upward-moving waves as corrections. By scrutinizing an uptrend, you’ll discover that it’s composed of five impulse waves and three corrective waves, consistent with Elliott’s theory. This same pattern can be identified within each wave occurring within the trend.
Principles of Elliott Waves
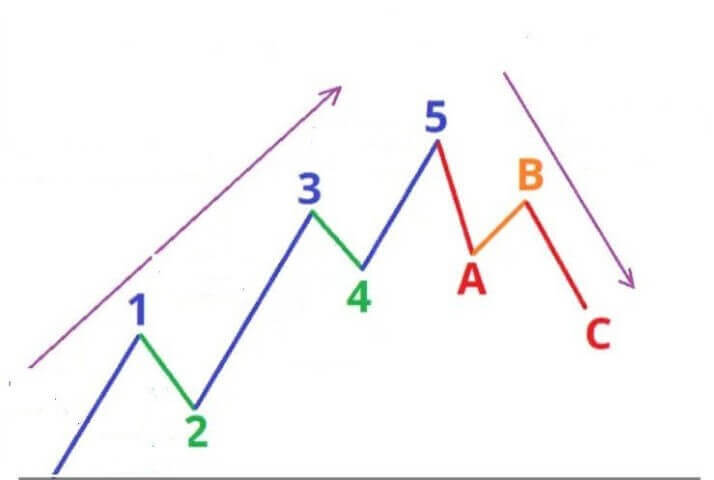
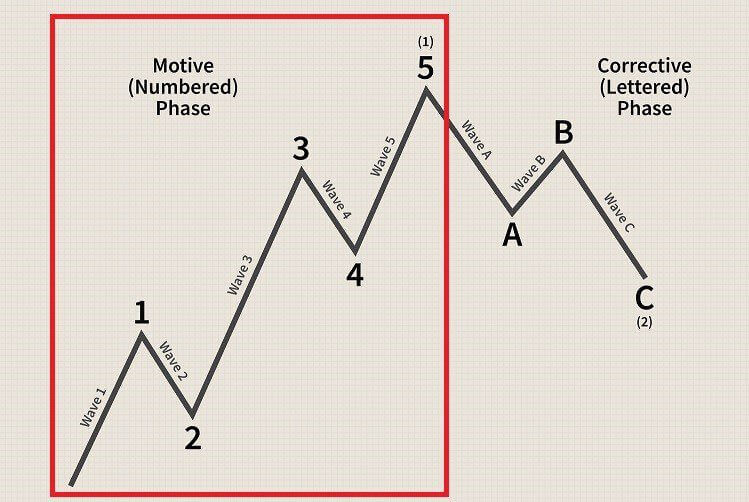
As previously mentioned, financial market trends seldom progress in a purely upward or downward direction. During their course, they traverse micro-waves that run counter to their primary trajectory. If we closely examine the chart below, we can observe an upward trend that has undergone a corrective phase. However, delving deeper into this process and considering its intricacies reveals that the ascending impulse wave is comprised of 5 micro-waves, indicated by numbers 1 to 5 in the diagram. These price movements, depicted on the charts, manifest as a result of the emotional and psychological conditions of traders and analysts.
Conversely, within the corrective wave, we encounter three micro-waves, denoted by English letters A, B, and C. In a broader context, impulse waves are typically designated with micro-waves labeled A, B, C, D, E, or numbers 1 to 5, while correction waves often utilize letters A, B, C, or letters W, X, and Y to delineate their constituent waves.
Grading of Elliott Waves
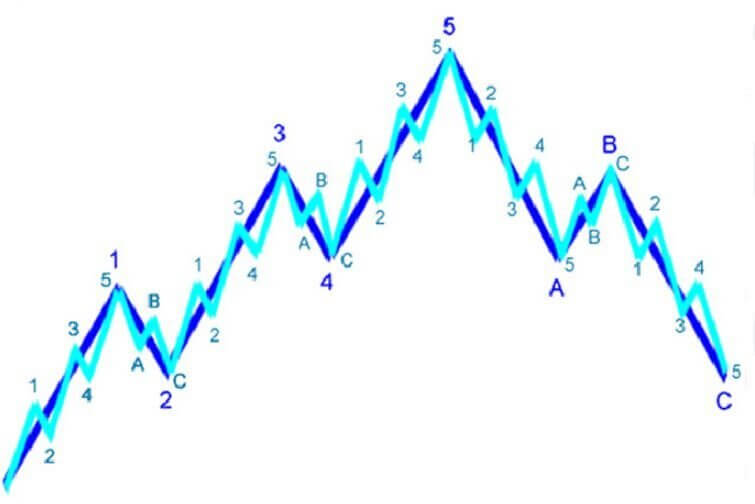
In our earlier exploration of Elliott’s theory’s historical context, we discussed how a series of repeating cycles shape price charts. To gain a deeper understanding, it’s beneficial to acquaint ourselves with the concept of a “fractal.” A fractal is a geometric shape where each small component resembles the whole.
For instance, if you were to examine a snowflake under a microscope, you’d observe that the tiny components making up the snowflake also possess the same snowflake shape, albeit on a smaller scale. Now, when we apply the concept of fractals to Elliott wave theory, we can say that within each impulse wave from 1 to 5, you’ll find waves 1 to 5 nested within.
To grasp this concept, imagine you’re analyzing an impulse wave on a price chart with a 4-hour time frame. Now, take that same price chart and reduce the time frame—say, to 30 minutes. By doing so, you can identify waves 1 to 5 within this micro-wave. This illustrates how Elliott Waves exhibit fractal patterns, with each wave containing smaller waves that mirror the larger trend.
Identifying Cryptocurrency Trends with Elliott Waves
Market participants and activists in financial markets often make decisions based on their feelings and perceptions, which influence their buying and selling transactions. Traditional and modern financial markets share many commonalities, including the use of price charts for tradable assets. These price charts serve as windows into market behavior and the psychology of market participants.
Even in the realm of cryptocurrency, with assets like Bitcoin and Ethereum, price charts play a vital role. Elliott Waves offer a valuable tool for predicting cryptocurrency trends and future price movements.
However, it’s important to note that while the cryptocurrency market is international in nature, some cryptocurrencies experience relatively low trading volumes, making it challenging to apply analytical tools effectively. In particular, analytical tools like Elliott Waves may not provide reliable signals for cryptocurrencies with low trading volumes or short histories.
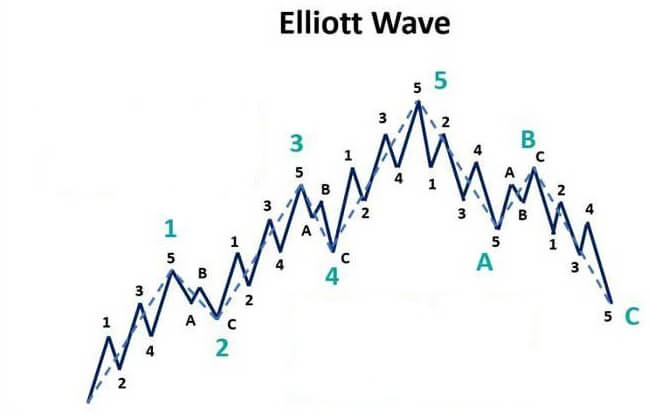
In general, Elliott Waves comprise eight waves, which often manifest as combinations of 3 and 5 on the price charts of various assets in financial markets. The initial pattern, consisting of 5 micro-waves, is referred to as impulse waves, while the final 3-wave pattern consists of corrective micro-waves. In the impulse wave pattern, which has 5 micro-waves, the 1st, 3rd, and 5th micro-waves are stimuli or impulses. Their movement direction aligns with the overall trend of the price chart. In contrast, micro-waves 2 and 4 are corrective and move against the primary trend of the price chart.
It’s essential to understand that both impulse waves (1-3-5) and corrective waves (2-4) are part of the primary waves (waves numbered 1 to 5) and are distinct from waves A, B, and C.
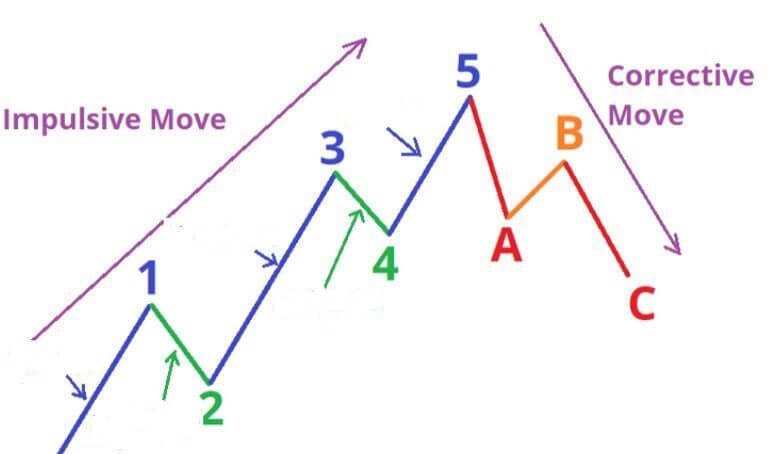
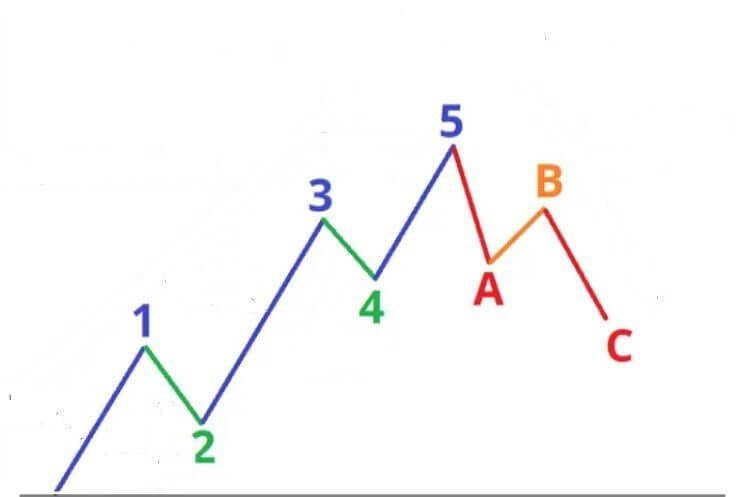
As depicted in the image below, if we consider the primary trend to be upward, waves 1, 3, and 5 move in the same direction as the main trend of the price chart and are marked in blue. Waves 2 and 4, marked in green, move in the opposite direction of the main trend and serve as corrective waves.
Corrective Waves in Elliott Waves
To grasp the concept of corrective waves, focus on the three micro-waves that follow micro-waves 1 to 5. These three micro-waves generally move in the opposite direction of the main trend depicted on the price chart. For instance, if the price chart for the EUR/USD currency pair is showing a bullish trend, the impulse waves—specifically, waves 1, 3, and 5 within the initial movement—align with the price chart’s upward direction.
Conversely, waves 2 and 4 move against the price chart’s direction. In micro-waves A, B, and C, the primary movement contradicts the price chart’s trend. In this context, waves A and C act against the main price chart direction. So, if the price chart’s primary trend is upward, waves A and C are bearish, while micro-wave B moves in harmony with the price chart’s main trend.
In summary:
Waves aligned with the price chart direction: Waves 1, 3, and 5 within the Impulsive Move and micro-wave B in the Corrective Move.
Waves moving contrary to the price chart direction: Waves 2 and 4 within the Impulsive Move and micro-waves A and C in the Corrective Move.
Trends and Stabilization in Elliott Wave Theory
If you’ve explored price charts in various financial markets, you’re likely aware that even robust upward trends cannot maintain their upward trajectory continuously without pause. Periodic pauses or, more precisely, corrections that occur within an uptrend are termed consolidations.
In Elliott Wave theory, stimulating waves are typically represented by numbers 1 to 5 or Roman numerals (i, ii, iii, iv, and v). As mentioned earlier, in an uptrend, micro-waves 1, 3, and 5 move in harmony with the primary upward trend. Conversely, micro-waves 2 and 4 move in the opposite direction of the primary trend, a phase known as stabilization or consolidation. These corrective phases play an essential role in Elliott Wave theory, allowing for a more accurate understanding of market dynamics.
Corrective Waves in Elliott Wave Theory
As we discussed earlier, in an upward trend, we observe the presence of five impulsive sub-waves and three corrective micro-waves. In this section, let’s delve into the specifics of corrective waves. These waves can manifest in various forms, from simple to more complex structures.
Recognizing corrective waves can be challenging due to their diverse forms. In the case of a simple correction pattern, we often encounter ABC micro-waves, forming zigzag-like irregular shapes without rigid principles.
Zigzag Correction Structure in Elliott Wave Theory
One common form of a corrective pattern is known as a zigzag. In a zigzag correction, the waves are composed of five micro-waves, moving in opposition to the main trend—namely, waves A and C. Conversely, wave B, which aligns with the primary trend, consists of three micro-waves. It’s important to note that we’re discussing a corrective wave within a significant uptrend, where A and C move against the primary upward trend, while B follows the trend’s direction.
As illustrated in the image, micro-wave B (depicted in orange) is part of the corrective wave within the primary upward trend and moves in the same direction as the main and upward trend. Recognizing and understanding these corrective wave patterns is a fundamental aspect of applying Elliott Wave Theory in market analysis.
But as we said, it is not always easy to recognize corrective waves; Because the forms of its formation are different and sometimes distinguishing the beginning of a corrective wave from the end of a kinetic wave is also a complicated issue; For example, sometimes in the corrective wave, we may see that microwave B is higher than the last kinetic microwave, and it is thought that B is a kinetic wave; While it is wrong.
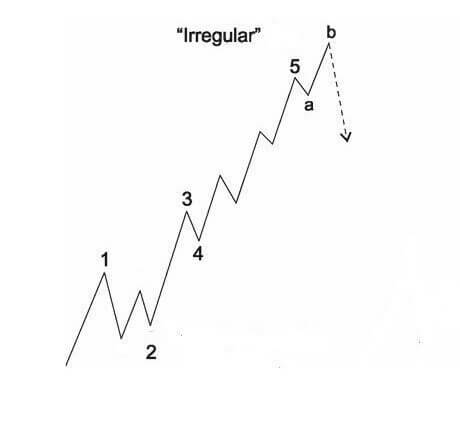
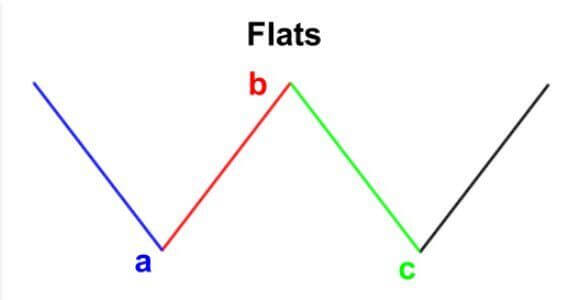
Another point that should be noted is that the corrective wave does not always have a downward trend, but sometimes it is formed in a smooth and horizontal way. This type of correction wave is known as flat correction wave.
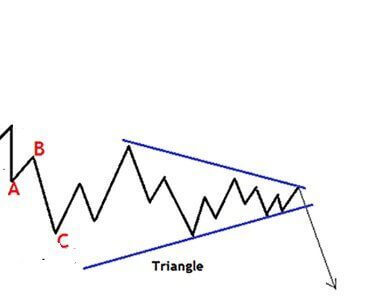
In addition to Flat and Irregular patterns, which are simple modification patterns, there is another form of simple pattern called triangular pattern, which requires the roofs to be shorter and the floors to be longer. By connecting the roofs and floors, we will see the formation of a triangle.
Complex Corrective Waves in Elliott Wave Theory
While simple correction waves are relatively straightforward to detect and analyze, complex correction waves present a more intricate challenge. It’s a fact that trader behavior significantly influences an asset’s price dynamics, particularly in prolonged bearish trends. During such extended downturns, Elliott Waves take on a more complex form. Complex corrections consist of two simple correction waves separated by an X wave, resulting in a more intricate corrective wave pattern.
The emergence of complex corrective waves and their intricate appearances are closely linked to shifts in trader behavior, notably in scenarios marked by extended downward trends. This change in trader sentiment and market dynamics leads to the development of non-standard, complex corrective patterns.
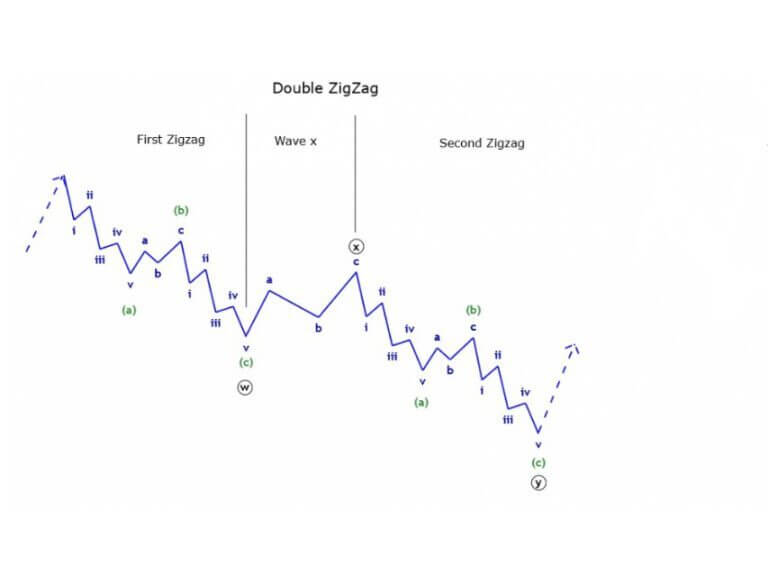
Complex Zigzag Correction Double Compound Structure
In the complex zigzag correction wave structure, as illustrated below, a simple zigzag correction wave initially forms. This is followed by an X wave, and then another zigzag correction wave unfolds. This combination of three correction waves constitutes the complex correction wave, forming a zigzag pattern.
It’s important to note that various forms of this complex structure may emerge, including the zigzag wave followed by X waves and a flat wave, a zigzag wave followed by X waves and a triangle wave, or a zigzag wave followed by X waves and an irregular correction pattern. Recognizing and interpreting these complex patterns require a thorough understanding of Elliott Wave Theory and careful analysis of market conditions.
Compound Structures in Elliott Wave Theory
Elliott Wave theory recognizes various compound structures that arise in financial markets, reflecting the complexity of market dynamics and trader behavior. These compound structures often consist of multiple corrective waves connected by “X” waves. Let’s explore some common examples:
1. Dual Compound Structure of Flat Modification
- Flat – X – Flat
- Flat – X – Zigzag
- Flat – X – Triangle
- Flat – X – Irregular
2. Irregular Modification Double Compound Structure
- Irregular – X – Irregular
- Irregular – X – Flat
- Irregular – X – Zigzag
- Irregular – X – Triangle
3. Zigzag Modified Ternary Compound Structure
- Zigzag – X – Zigzag – X – Zigzag
- Zigzag – X – Flat – X – Triangle
- Zigzag – X – Irregular – X – Flat
- Zigzag – X – Irregular – X – Triangle
4. Triple Compound Structure of Flat Modification
- Flat – X – Flat – X – Flat
- Flat – X – Zigzag – X – Triangle
- Flat – X – Zigzag – X – Irregular
- Flat – X – Irregular – X – Zigzag
5. Structure of Ternary Composition of Irregular Modification
- Irregular – X – Irregular – X – Irregular
- Irregular – X – Flat – X – Triangle
- Irregular – X – Flat – X – Zigzag
- Irregular – X – Zigzag – X – Triangle
These compound structures can manifest in price charts as market participants react to evolving market conditions. Analyzing these patterns and understanding their implications is a valuable skill for Elliott Wave practitioners, allowing for more precise market forecasting and decision-making.
Fibonacci Ratios in Elliott Waves
Ralph Nelson Elliott, the developer of the Elliott Wave theory, used a variety of tools to define waves and forecast potential price reversals. Among these tools, the use of Fibonacci ratios is a prominent feature. These ratios play a crucial role in understanding and predicting corrective movements within a trend, particularly in an uptrend.
According to Elliott, several Fibonacci ratios hold significance in the waves he introduced. These include 38.2%, 50%, 61.8%, 100%, 161.8%, 200%, and 238.1%. It’s essential to note that the likelihood of price retracement to each of these ratios varies across different waves.
Here are some examples of how Fibonacci ratios are applied in different waves:
- Second Wave (61.8%): In the context of Elliott Waves, the 61.8% ratio is particularly valid for the second wave. This means that after correcting approximately 61.8% of the initial upward move (the first wave), we often witness the commencement of the second upward wave.
- Fourth Wave (38.2%): When the third wave, which represents a strong upward move, concludes, the fourth wave correction is likely to retrace around 38.2% of the entire ascent. This is a common behavior observed in Elliott Wave analysis.
- Fifth Wave (38.2% or 61.8%): After considering the upward journey from the start of the first wave to the end of the third wave, it’s often observed that the fifth wave retraces approximately 38.2% or 61.8% of the distance covered during that path.
By incorporating these Fibonacci ratios, Elliott Wave practitioners aim to pinpoint potential reversal points and anticipate the extent of corrective movements, enhancing their ability to forecast price dynamics within the context of this popular technical analysis method.
Elliott Waves Fibonacci Ratios for Different Waves
Wave 2:
- When analyzing the second wave, Fibonacci retracement is often used. This wave typically corrects to either the 61.8% or 78.6% Fibonacci retracement levels.
- After the correction, the third wave, which is an upward wave, is expected to begin. Wave 2 should never retrace beyond 100% of the distance traveled by the first wave.
Elliott Wave 3:
- For projecting the end of wave 3, Fibonacci projection on wave 1 is commonly employed.
- When applying Fibonacci extension on wave 2, it’s common to observe the end of wave 3 crossing the 261 or 361 ratios.
Important Points for Wave 4:
- To predict the end of wave 4, Fibonacci projection on wave 1 is useful. The fourth wave often terminates around the 161 or 261 Fibonacci projection ratios.
- Using Fibonacci extension on wave 2 can indicate that the end of wave 4 will align with the 261 or 361 Fibonacci ratios.
- The correction in wave 4 can take various forms, including complex or flat corrections. In the case of a flat correction, it might take a relatively extended period to complete.
- If the overall trend is bullish, wave 4 is bearish. In such cases, the decline in wave 4 should typically amount to at least 6% of the third wave, and it often ranges between 38.2% and 50% of wave 3.
Elliott Wave 5:
- To project the end of wave 5, applying Fibonacci extension on wave 4 is a common approach, and it often suggests ratios of 127 or 161.
- Using Fibonacci projection on wave 1 can also guide the placement of the end of wave 5, often at 100 or 161 percent ratios.
- There’s a possibility of a butterfly pattern forming at the conclusion of wave 5.
- Wave 5 tends to be at least five times longer than wave 1.
- It’s possible that wave 5 may not surpass the highs achieved in wave 3, and it might appear truncated.
- Wave 5 consists of five additional micro-waves within it.
- By drawing Fibonacci projections on waves 1 to 3, the end of the entire movement (the end of wave 5) is often projected at the ratios of 2.38 or 8.61.
Utilizing Fibonacci ratios in Elliott Wave analysis allows traders and analysts to gain valuable insights into potential reversal points and the magnitude of price movements across different waves, enhancing their ability to make well-informed trading decisions.
Fibonacci Ratios in Corrective Waves (Wave A, Wave B, Wave C)
Wave A (Corrective Waves):
- To project the end of wave A, applying Fibonacci extension on wave 4 is a common practice. This often suggests corrections at the 127 or 161 Fibonacci ratios.
- Another approach is to use Fibonacci projection on wave 1, where the 100 or 161 ratios typically mark the end of wave A.
- Wave A can exhibit either 3 or 5 micro-waves within its structure.
- There’s also a possibility of forming a butterfly pattern in this wave.
W B (Corrective Waves):
- When projecting the end of wave B, using Fibonacci retracement on wave A is a common technique. This typically identifies the end of wave B around the 61.8% or 78.6% Fibonacci ratios.
- Alternatively, Fibonacci retracement applied on wave A may indicate that the end of wave B falls at the 161 or 127 ratios.
Wave C (Corrective Waves):
- By utilizing Fibonacci retracement on wave 1, it’s often observed that the end of wave C crosses the 61.8% or 78.6% Fibonacci ratios.
- Employing Fibonacci extension on wave B is another method, with the end of wave C commonly found at the 161 or 262 ratios of wave B.
- Similar to wave A, drawing a Fibonacci projection on wave A can guide the placement of the end of wave C, typically at the 100 or 161 Fibonacci ratios.
Understanding these Fibonacci ratios in corrective waves is essential for Elliott Wave analysts as it assists in predicting reversal points and assessing the extent of corrections in price movements, contributing to more informed trading and investment decisions.
Combining Elliott Waves with Technical Indicators
While some technical analysts exclusively rely on Elliott waves to determine price trends and future asset movements, this versatile tool can be effectively combined with other analytical instruments, such as technical indicators, to validate signals generated by Elliott waves.
Elliott Waves and Fibonacci Retracement Levels:
- Elliott waves, which consist of 5 impulse waves and 3 corrective waves, offer a structured approach to understanding trend changes.
- For instance, after the conclusion of wave 1 (an upward movement), wave 2 (a downward movement) typically begins. Recognizing the initiation and termination of both upward and corrective movements in different waves forms the basis of Elliott waves.
- Similarly, Fibonacci retracement levels serve the same purpose by identifying potential support and resistance levels. These ratios can also be used to pinpoint the termination of a wave. As previously mentioned, various types of Fibonacci tools are available for this purpose.
By integrating Elliott waves with technical indicators and Fibonacci retracement levels, traders can enhance their trading strategies, gain confirmation for Elliott wave signals, and make more informed decisions about entry and exit points, thereby improving their trading performance.
Elliott Wave Oscillator (EWO)
Recognizing Elliott Waves on price charts requires both comprehensive training and practical experience. For those who find it challenging to identify the various phases of Elliott Waves on price charts, the Elliott Wave Oscillator (EWO) can be a valuable tool.
The EWO typically features four colors, and users can customize these colors to their preference. By default, there are two colors for the positive mode and two for the negative mode.
Here’s how the EWO’s color-coding system works:
- When the oscillator chart transitions from the negative side to the positive side, the bars are displayed in dark blue.
- As the graph moves from the positive phase it is in to the baseline (zero), the bars change to light blue.
- When the oscillator enters the negative phase, the bars adopt an orange color.
- If it moves toward zero or the baseline, the bars turn yellow.
Experienced analysts often use the EWO in conjunction with other tools, such as the RSI indicator, MFI, and more, to obtain more precise and reliable signals for their trading decisions. This multi-faceted approach can enhance the accuracy of their analysis and trading strategies.
Use of Elliott Waves in the Stock Market
Elliott Waves, like other analytical tools, serve as valuable aids for analysts and traders in forecasting future asset and index prices based on trader behavior. This is rooted in the concept that traders often repeat their past behaviors under similar market conditions. As a result, patterns and Elliott waves have become prevalent on price charts, enabling analysts to utilize these well-established waves to anticipate stock market trends and make timely buy or sell decisions. Here are some applications of Elliott waves in the stock market:
- Stock Selection: If you’re considering investing in shares of a company less influenced by economic factors, Elliott waves can assist in identifying entry and exit points, thereby guiding your stock selection process.
- Market Makers: In stock markets with active market makers, Elliott waves can be particularly valuable. Market makers often influence the price movement of specific shares. When trading a symbol with an active market maker, applying Elliott waves can help provide more accurate results, given the relatively conventional behaviors seen in such symbols.
- High Volume Trading: Given that Elliott Waves are a relatively complex analytical tool that becomes especially beneficial in the hands of those who master it, they are recommended for high-volume trading. Incorporating Elliott waves into your analysis can help you identify entry points when buying or selling multiple trading symbols.
- Time Frame Selection: If you prefer daily or weekly time frames for analyzing and executing your transactions in the stock market, Elliott waves can be an advantageous addition to your analysis toolkit.
By using Elliott waves, traders and investors can gain deeper insights into market dynamics, anticipate price movements, and improve the timing of their stock market transactions, ultimately enhancing their potential for successful trading and investment strategies.
Should You Use Elliott Waves for Market Analysis?
The answer to whether you should use Elliott waves for market analysis varies among financial market participants. In general, any analytical tool aims to assist traders in finding optimal entry and exit points in the market. Elliott waves stand out as one of the most comprehensive and accurate technical analysis tools for identifying these critical points.
However, it’s essential to understand that mastering Elliott waves isn’t a quick endeavor. Learning a few patterns from a training course isn’t sufficient for effective use. To harness the power of Elliott waves, you must acquire a deep knowledge of the waves, gain practical experience, and be able to apply them effectively in live market conditions.
Learning a subject and using it effectively are two distinct processes, and practical proficiency is key. If you reach a level of expertise where you can confidently apply Elliott waves, they can significantly enhance your ability to profit from the market.
For newcomers to the financial markets, it’s advisable to start with simpler technical analysis tools to identify entry and exit points. As you gain experience and knowledge, you can consider incorporating Elliott waves into your analysis toolbox.
In Conclusion: Technical analysis encompasses a wide array of tools, and analysts often use multiple tools to ensure accurate analysis. While some traders believe that Elliott waves alone can provide precise signals, the complexity and learning curve associated with this technique make it a powerful but challenging choice. It’s important to choose the analytical tools that align with your experience and expertise to make informed trading decisions.